

Stembrook Market Review - Third Quarter 2025
Market UpdatesAs expected the majority of market participants expected, the Federal Reserve made the decision to lower interest rates by 0.25% at their September meeting. Market participants expect 1-2 additional rate cuts by the end of this year. Stocks continued to march upwards in the quarter with global stocks up 7.6%, building on an 18.4% gain year-to-date.1 Generally, lower interest rates are welcomed news for the fixed income market because lower rates cause the prices of existing bonds to increase. U.S. bonds were up just over 2% in quarter, adding on to strong gains this year, up 6.1%.2
As of the date of this note, the government shutdown continues. The longer this shutdown continues, the greater the impact on economic growth due to economic uncertainty, a lack of Treasury auctions and furloughed government employees. In addition, this shutdown also limits the data flow of key economic releases, such as employment, inflation, and GDP, just to name a few. Economists and market participants heavily rely on these data to base their forecasts and make investment decisions. Participants are forced to shift to additional data sources provided by private entities. This can lead to inconsistent or delayed decisions by both investors and policy makers. That being said, during the last 5 government shutdowns the S&P 500 has averaged a positive return of 4.4%.3 Currently the S&P is down -0.8% since the start of the shutdown.4
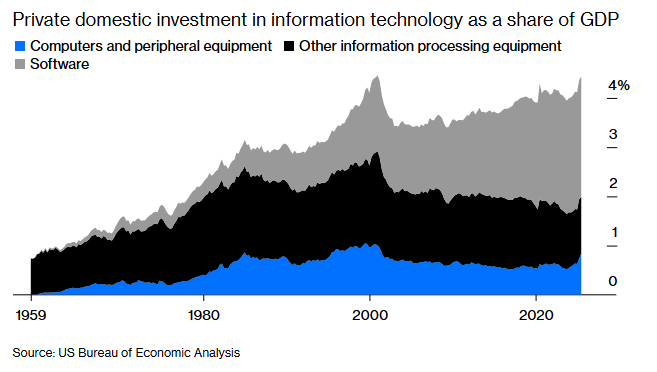
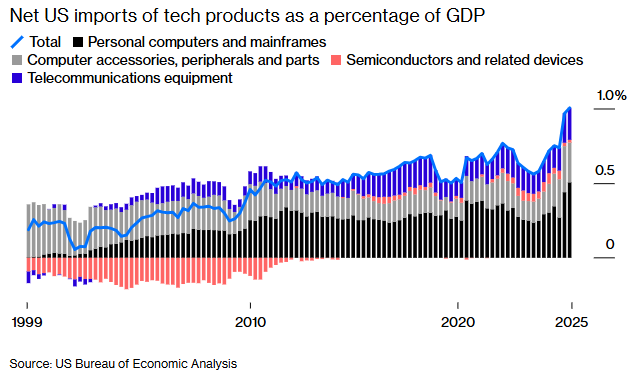
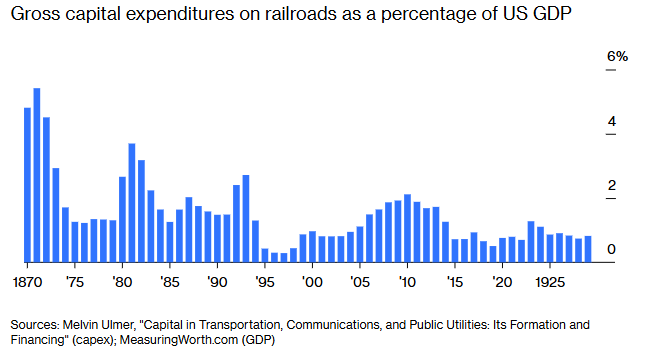
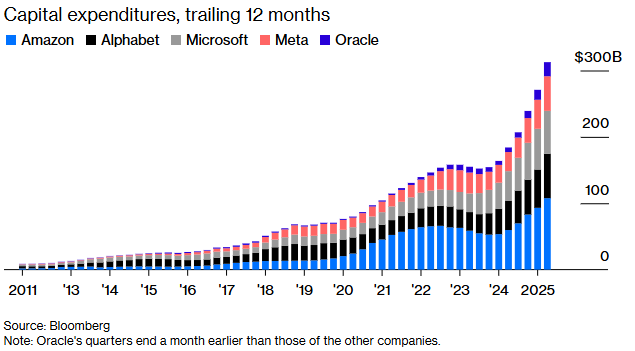
Artificial Intelligence (AI) investment has dominated the financial headlines over the past year. We previously noted the dominance of the Magnificent 7 stocks in our December 2024 note, but wanted to take a deeper dive to see how large the AI buildout stands on a historical basis. Outlined by Bloomberg, the charts below show the scale of the AI build out. The first chart below looks at private domestic investment in IT as a percentage of GDP. This figure currently stands at 4.4%, just below the 4.6% peak that was witnessed at the end of 2020. Assuming the growth trajectory remains, we will exceed the previous high water mark by the end of the year. Estimates of the $300 billion in capital expenditures on AI data centers hovers around 1.3% of GDP. This is up from 0.8% of GDP last year and 0.3% in 2023. To put in historical context, this compares to telecom Capex as 1% of GDP at the peak of the 2000 boom, but pales in comparison to the 6% portion of GDP that the railroad industry contributed in the late 1800s. Imports of technology-related products are also up to around 1% of GDP. The current figures range from 15% to nearly 50% of Capex for the 5 largest players in this industry. The investments are large but not unprecedented on a historical basis, but it is important to note that the investment is a large portion of Capex for the top players in this industry.5
AI Investment is Elevated
Our proprietary models forecast long-term, pre-tax returns ranging from 3% to 4% for fixed income-like asset classes and 9% to 10% for equity-like asset classes (see Expected Market Returns and Risks table). Our more detailed observations and current portfolio positioning are outlined in the following comments.
Expected Market Returns and Risks 7-10 Year Horizon
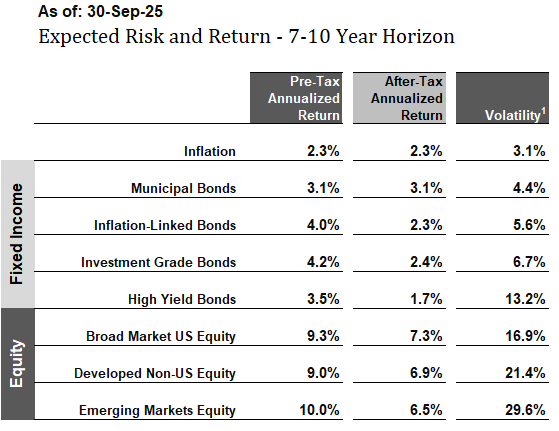
A sampling of return expectations produced by our models. Expected returns are projections and are not guaranteed.
Historical Market Returns
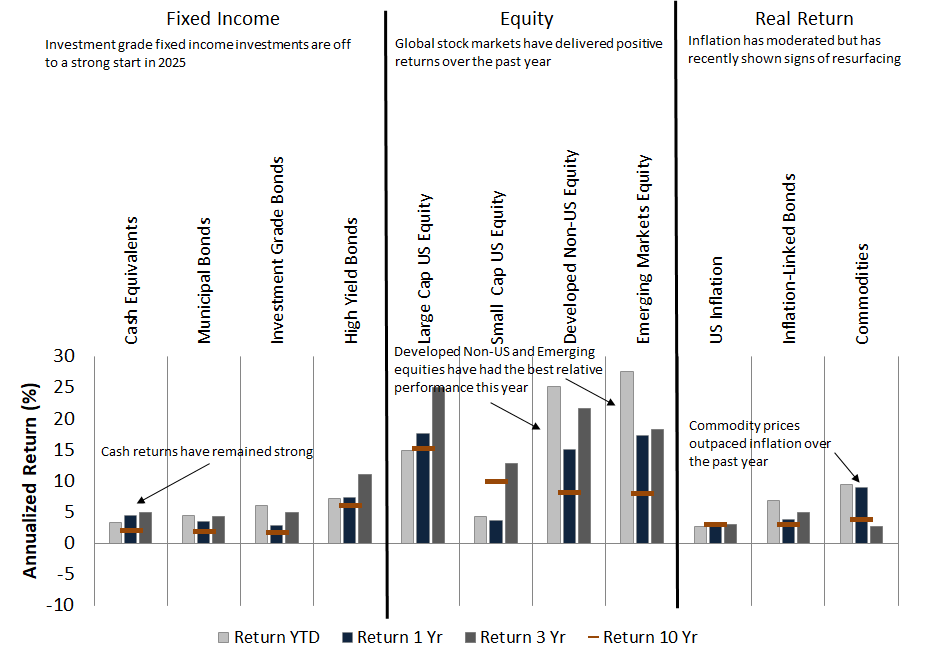 Historical market returns as of September 30th 2025. Note that looking backwards at recent returns is not a reliable method of predicting future returns.
Yields Across Asset Classes
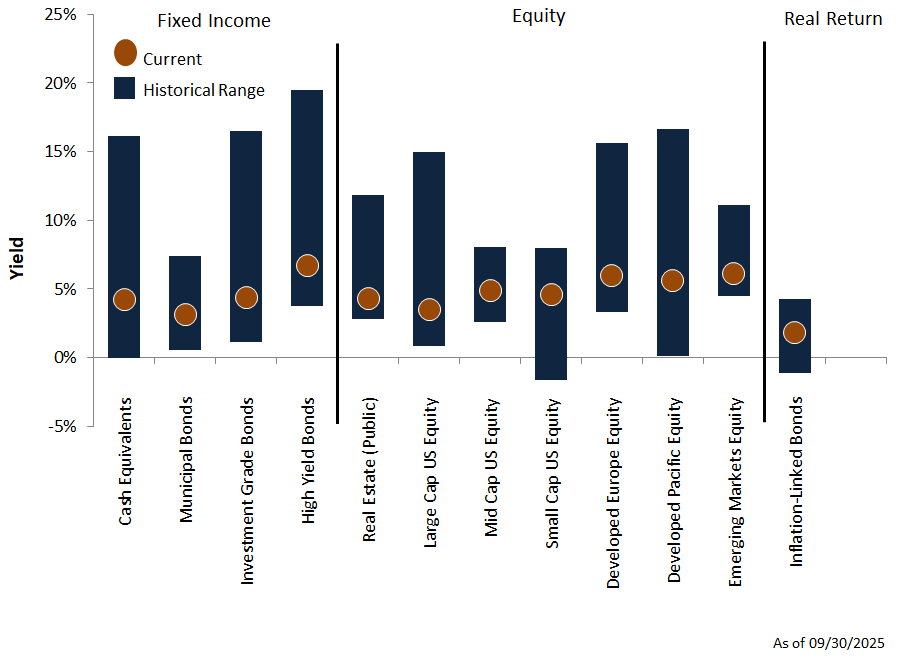 Yields are an indicator of future returns. Orange dots show current yields, blue bars show historical ranges.
Economic Backdrop
- The IMF provided a slight upgrade to their global growth forecasts for 2025 and 2026, citing front-loading ahead of tariffs, lower effective tariff rates, better financial conditions and fiscal expansion in major economies. In their July 2025 update, the IMF forecasted that world economic output would maintain a 3% annualized pace this year, adjusted for inflation. Economists expect growth to tick up slightly to 3.1% in 2026.6
- Continued economic weakness is expected to persist in the United States, with growth expected to be 1.9% in 2025 and 2.0% in 2026. While this level of growth is underwhelming, it exceeds the average growth rate for advanced economies.6
- Emerging economies also received a slight upgrade to GDP expectations for this year and next. Economists at the IMF expect GDP in emerging economies to be4.1% this year and 4.0% next year, down slightly from 2024.6
- The IMF lowered inflation expectations slightly to 4.2% in 2025 and 3.6% next year.6
- As mentioned earlier, we and other investors will patiently await economic data from U.S. governmental agencies upon the reopening of the U.S. government. This lack of data can impact the Fed's next decision on interest rates, but as previously stated, most market participants expect 1-2 more rate cuts before year end.
- Emerging markets stocks continued to have strong returns, leading the way in the third quarter, up 10.6%.7
- Non-U.S. stocks continued to post strong returns up 4.8% on the quarter.8
- Broad U.S. stocks continue to deliver solid returns, up 8% for the quarter.9
- Technology stocks rallied back on strong earnings and continued AI enthusiasm, up 9% for the quarter.10
- Municipal bonds rebounded after a difficult start to the year due to supply a demand dynamics, up 3% in the third quarter.11
- After very strong performance in the second quarter, global bond prices retreated, down 8% over the last 3 months.12
- Much like the equity market, emerging bond markets rallied as well, up 4.9%.13
Global Asset Class Returns

Returns are arranged in columns, by year. Each color represents a different asset class. Each year, the leaders and laggards tend to shift. Diversification across a range of asset classes can smooth returns and enhance growth.
- We maintain our neutral duration position in fixed income portfolios as interest rates have risen to levels closer to historical averages.
- We maintain our neutral allocation to emerging market equities.
- We maintain a neutral exposure in large-cap U.S. equities.
- We favor lower priced, value-oriented equities, both in the U.S. and abroad, which tend to outperform the broad market over time, with less volatility. We are optimistic about their return potential going forward.
We continue to focus our efforts on helping you meet your financial objectives by following our disciplined investment approach. Our approach uses return and risk models, incorporating fundamental valuations and tax-efficient strategies. This investment discipline is tailored to your individual situation in our continuing effort to craft and implement your customized investment solution.
As we approach the end of the year, please keep tax planning and gifting strategies in mind. If you would like to discuss your specific tax situation or plans for year-end gifting, please let us know and we can schedule a time to speak.
As always, we thank you for placing your trust in our investment management and advice and welcome your questions and comments at any time.
Peter & Tom
Endnotes and Sources:
Text:
- Morningstar: MSCI ACWI NR USD. 6/30/2025 - 9/30/2025.
- Morningstar: Bloomberg US Aggregate Bond Index. 6/30/2025 - 9/30/2025, 12/31/2024 - 9/30/2025.
- Morgan Stanley Smith Barney.
- Morningstar: S&P 500 TR. 9/30/2025 - 10/16/2025.
- Justin Fox via Bloomberg: https://www.bloomberg.com/opinion/articles/2025-10-08/the-ai-spending-boom-is-massive-but-not-unprecedented
- IMF World Economic Outlook Update: July 2025.
- Morningstar: MSCI ACWI Emerging Markets NR USD. 6/30/2025 - 9/30/2025.
- Morningstar: MSCI EAFE NR USD. 6/30/2025 - 9/30/2025.
- Morningstar: S&P 1500 TR. 6/30/2025 - 9/30/2025.
- Morningstar: NASDAQ 100 TR. 6/30/2025 - 9/30/2025.
- Morningstar: S&P National AMT Free Muni TR USD. 6/30/2025 - 9/30/2025.
- Morningstar. FTSE WGBI NonUSD USD. 6/30/2025 - 9/30/2025.
- Morningstar: Morningstar EM Sov Bond GR USD. 6/30/2025 - 9/30/2025.
Charts:
AI Investment is Elevated
Source: Justin Fox via Bloomberg: https://www.bloomberg.com/opinion/articles/2025-10-08/the-ai-spending-boom-is-massive-but-not-unprecedented
Expected Market Returns and Risks, 7-10 Year Horizon: As of 9/30/2025.
Source: Stembrook Research.
(1) Volatility is measured in terms of Standard Deviation. Standard deviation is the statistical measurement of dispersion about an average, which depicts how widely a stock or portfolio’s returns varied over a certain period of time. Investors use the standard deviation of historical performance to try to predict the range of returns that is most likely for a given investment. When an investment has a high standard deviation, the predicted range of performance is wide, implying greater volatility. If an investment’s returns follow a normal distribution, then approximately 68 percent of the time they will fall within one standard deviation of the mean return of the investment, and 95 percent of the time within two standard deviations. For example, for a portfolio with a mean annual return of 10 percent and a standard deviation of two percent, you would expect the return to be between 8 and 12 percent about 68 percent of the time, and between 6 and 14 percent about 95 percent of the time. Source: Morningstar.
Historical Market Returns: As of 9/30/2025.
Source: Morningstar, Stembrook Research.
Indices: Bloomberg Barclays U.S Treasury Bills 1-3 Month Total Return, Bloomberg Barclays Municipal Bond 5 Year (4-6) Total Return, Bloomberg Barclays U.S. Aggregate Bond Total Return, Bloomberg Barclays U.S. Corporate High Yield Total Return, FTSE All Equity REIT Total Return, S&P 500 Composite Total Return, S&P SmallCap 600 Total Return, MSCI EAFE Total Return, MSCI EM (Emerging Markets) Total Return, Consumer Price Index – U.S., S&P 10 Year U.S. TIPS Total Return, Bloomberg Commodity (Total Return) Index.
Yields Across Asset Classes: As of 9/30/2025.
Sources: Cash Equivalents Yields since March 1976. Ibbotson, Federal Reserve Bank, Thomson Reuters, Municipal Bond Yields since March 1988. Barclays Capital, Charles Schwab, BofA Merrill Lynch, Standard & Poor's/Investortools Municipal Bond Indices, Investment Grade Bond Yields since March 1976. Barclays Capital, High Yield since December 1984. BofA Merrill Lynch, Barclays Capital, Real Estate (Public) Earnings Yield since March 1976. NAREIT all Equity, Large Cap U.S. Equity Earnings Yield since March 1976. Standard & Poor's, BARRA, Mid Cap U.S. Equity Earnings Yield since June 1991. Standard & Poor's, BARRA, Small Cap U.S. Equity Earnings Yield since December 1993. Standard & Poor’s, BARRA, Developed Europe Equity Earnings Yield since March 1976. MSCI Europe, Standard & Poor's Europe 350, Developed Pacific Equity Earnings Yield since March 1976. MSCI Pacific, S&P/Citi PMI Asia Pacific, S&P Asia 50, Emerging Market Equity Earnings Yield since December 1998, Inflation-Linked Bond Real Yield to Maturity since March 1997. Citi Yield Book, Federal Reserve Bank. Note: Yields are not perfect predictors of future returns and should not be used in isolation.
Global Asset Class Returns: As of 12/31/2024.
Source: Thomson Reuters, Bloomberg, Morningstar, Stembrook Research.
Indices: Consumer Price Index – US, U.S. 30-Day Treasury Bills, Bloomberg Barclays U.S. Treasury Bills: 1-3 Month Index, Citigroup Inflation-Linked Index, S&P 10 Year US TIPS Index, Bloomberg Barclays U.S. Aggregate Bond Index, BofA Merrill Lynch U.S. High Yield Cash Pay, Bloomberg Barclays U.S. Corporate High Yield Index, Dow Jones Wilshire REIT Index, FTSE All Equity REIT Index, S&P 500 Composite Total Return, S&P SmallCap 600 Total Return, MSCI EAFE Index, MSCI EM (Emerging Markets) Index, Dow Jones AIG Commodity (Totl Ret) Index, Bloomberg Commodity Index.
Disclosures
This material is intended to inform you of products and services offered by Stembrook Asset Management, LLC (“Stembrook”). Stembrook is a U.S. Securities and Exchange Commission Registered Investment Advisor.
This material is not intended as an offer or solicitation for the purchase or sale of any financial instrument.
We believe the information contained in this material to be reliable but do not warrant its accuracy or completeness. The opinions, estimates, and investment strategies and views expressed in this document constitute the judgment of Stembrook, based on current market conditions and are subject to change without notice. The investment strategies stated here may differ from those expressed for other purposes or in other context.
Past performance is not indicative of future results.
The obligations and securities sold, offered, or recommended are not deposits and are not insured by the FDIC, the Federal Reserve Bank, or any governmental agency.
The views and strategies described herein may not be suitable for all investors. This material is presented with the understanding that it is not rendering accounting, legal or tax advice. Please consult your legal or tax adviser concerning such matters.
Important note regarding Stembrook’s capital market expectations.
The capital market expectations developed by Stembrook Asset Management are estimates of both a central tendency of asset class behavior and a probable range of asset class behavior over a long-term horizon. These estimates are one of many inputs used in the portfolio construction process, and should not be used independently. These expectations should not be construed as the returns that will be achieved, but merely those that may be achieved if certain assumptions hold true. Also note that each client's portfolio may differ given specific goals and constraints applied to the portfolio construction process.
Additional information is available upon request.