

Stembrook Market Review - Second Quarter 2026
Market UpdatesAfter an uneasy start to the year, equity markets bounced back in the second quarter of 2026 thanks to cooling inflation and continued strength in corporate profits which passed through to strong earnings. Though the military situation in the middle east, which restricted oil transport in the Strait of Hormuz is still not resolved, signs of a ceasefire and a potential resolution relieved the pressure that had forced oil prices over $100 per barrel in the first quarter. Oil prices ended the quarter at $70 per barrel after peaking over $100 per barrel earlier this year.1 This eased inflation concerns in the short-run and reduced equity investors' uncertainty. It is important to note that this situation is not resolved, and we may still see further spikes in oil prices which can flow through to inflation. Persistent uncertainty and prolonged higher inflation can ultimately have damaging effects on both the economy and markets.
As noted earlier, the quarterly rate of inflation dropped to just above 1% from a level that was approaching 2% in the first three months of the year. During this period, global stocks rebounded, up 14.9%.2 After a slow start to the year, stocks continued to deliver strong returns driven by strong revenue growth and margin expansion which led to stronger earnings. It is worth noting that within the US, this growth has been driven by stocks outside of the "Magnificent 7" which we highlighted in our Fourth Quarter 2024 Market Review. Year-to-date, the S&P 500 is up 10% while Magnificent 7 stocks are unchanged. The remaining 493 stocks have accounted for a 15% return year-to-date. Up until this point, the Magnificent 7 has consistently outperformed the rest of the market over the last 5 years with the exception of the year 2022.3
The Impact of Strong Earnings Growth and Margin Expansion
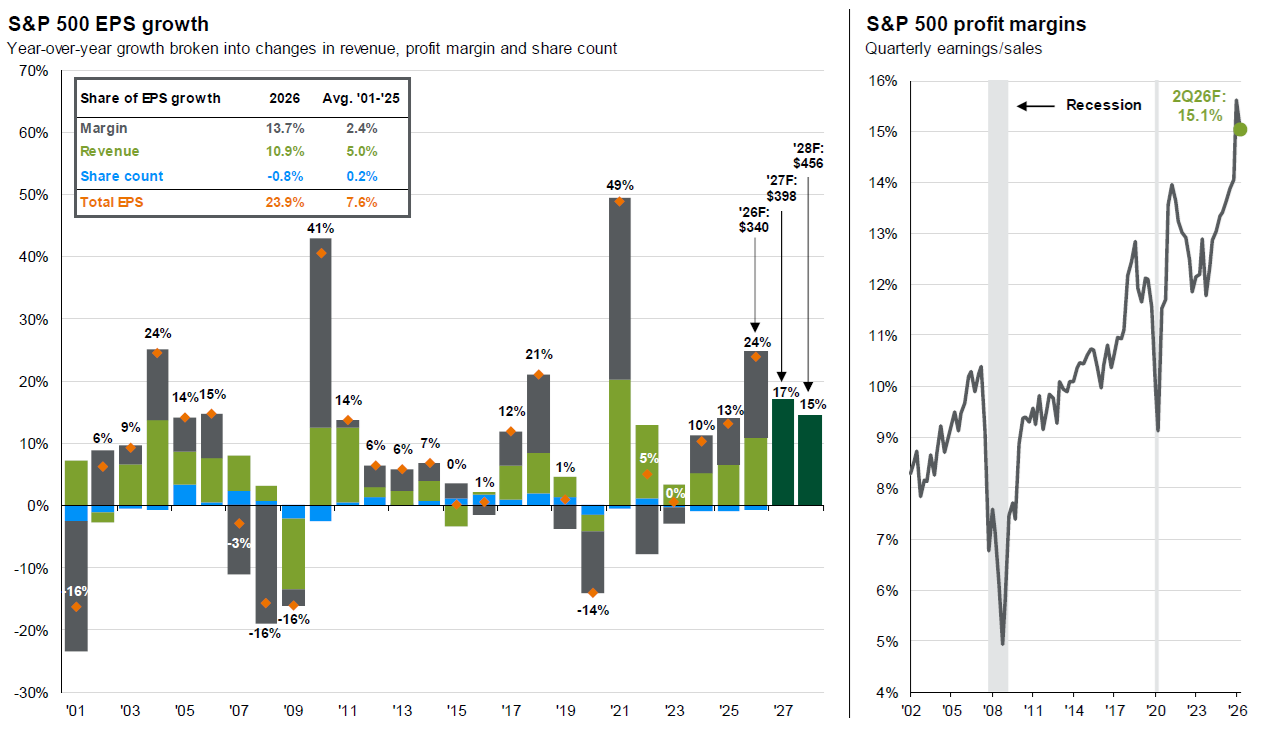 Strong revenue growth and margin expansion have driven stock returns.
Our proprietary models forecast long-term, pre-tax returns ranging from 3% to 5% for fixed income-like asset classes and 9% to 10% for equity-like asset classes (see Expected Market Returns and Risks table). More detailed observations and current portfolio positioning are outlined in the following comments.
Expected Market Returns and Risks 7-10 Year Horizon
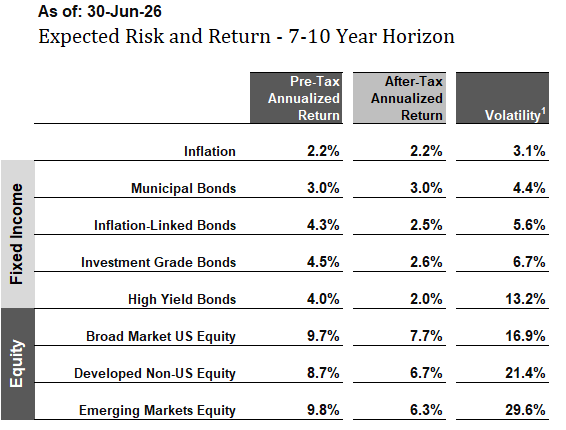
A sampling of return expectations produced by our models. Expected returns are projections and are not guaranteed.
Historical Market Returns
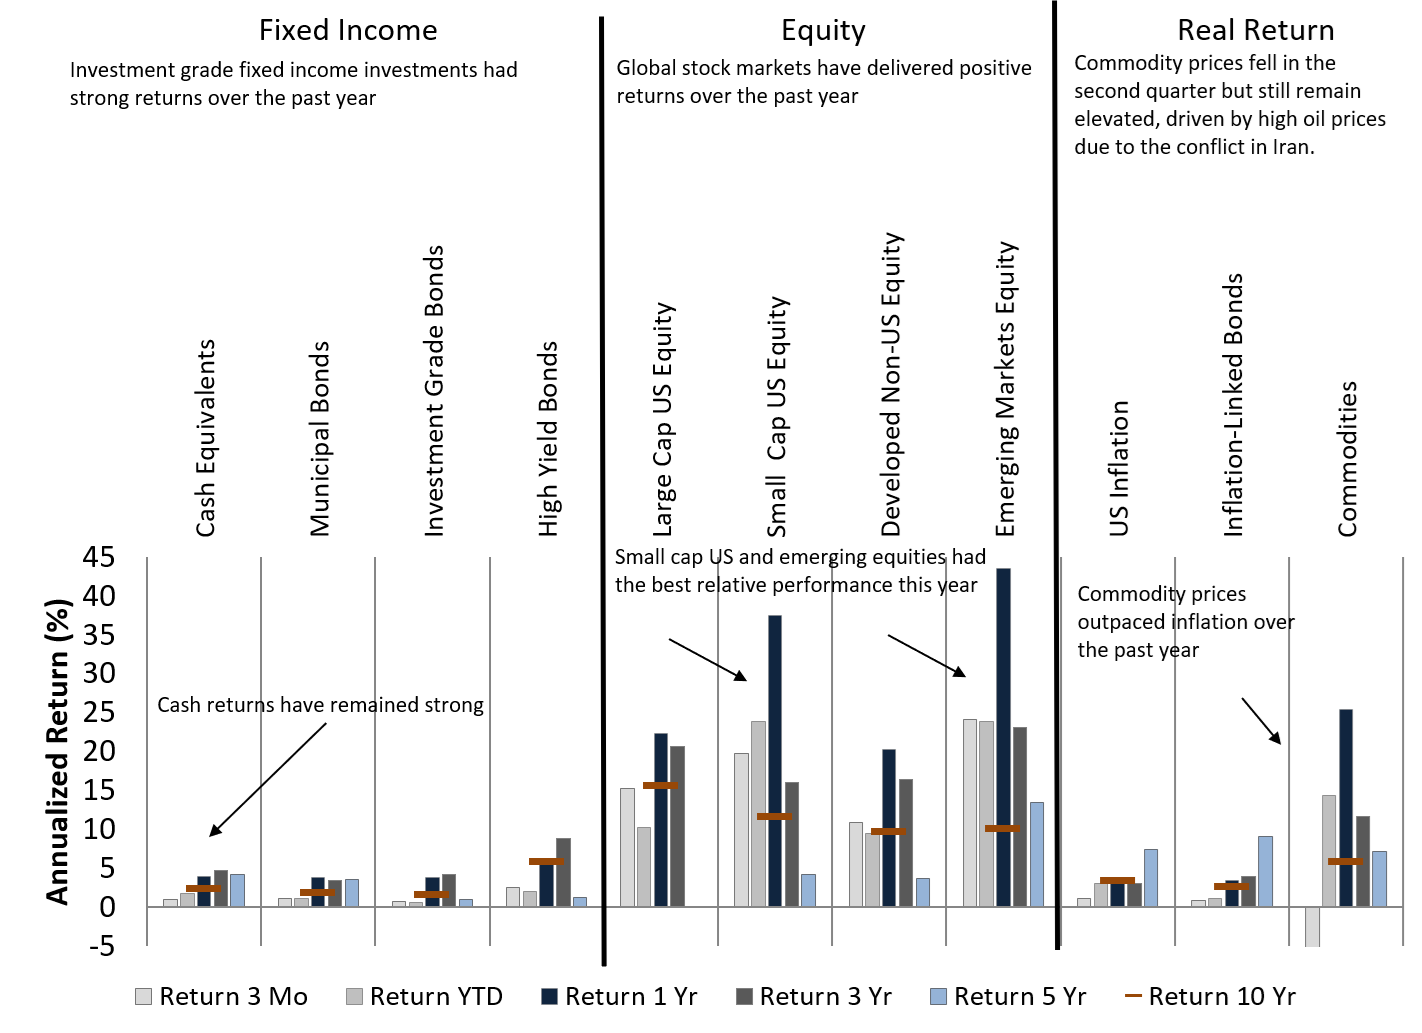 Historical market returns as of June 30th, 2026. Note that looking backwards at recent returns is not a reliable method of predicting future returns.
Yields Across Asset Classes
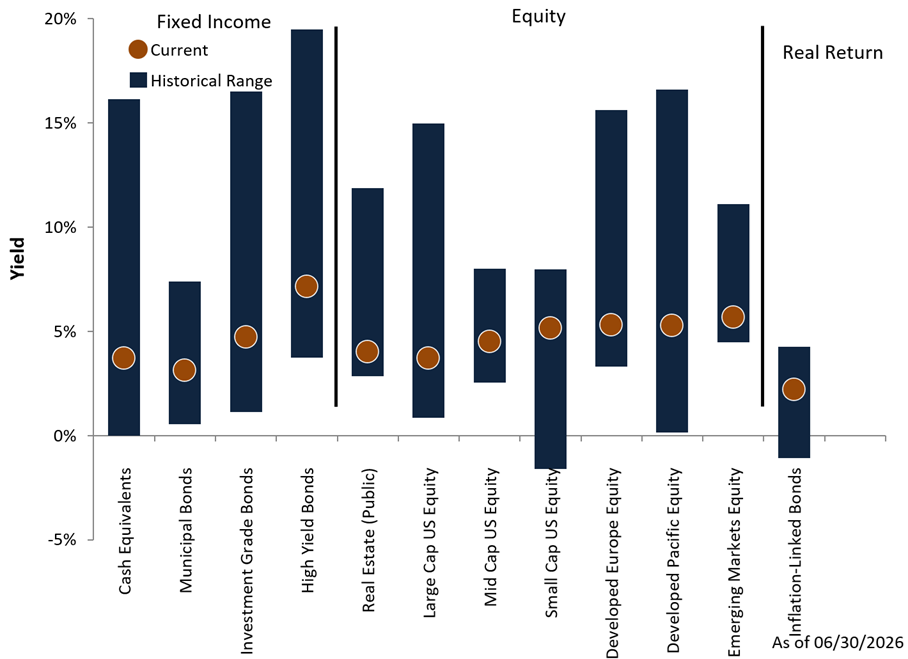 Yields are an indicator of future returns. Orange dots show current yields, blue bars show historical ranges.
Economic Backdrop
- For the second consecutive quarter, the IMF lowered its guidance for projected global GDP growth to 3.0% in 2026 and 3.4% in 2027. To put this in perspective, the average level of growth was 3.5% for 2024-2025. The council cites continued slowdown from the conflict in the middle east that is being partially offset by advances in artificial intelligence.4
- Consistent with their forecast for other advanced economies, the IMF expects economic growth in the United States to decelerate to 2.3% this year, with modest decreases over the following two years due, in part, to higher energy prices.4
- Emerging economies are also expected to see a deceleration in growth, dropping below 4.0% to 3.8% in 2026, followed by an increase to 4.5% next year, with continued strength in Asian markets.4
- Inflation remains a concern for the IMF. On a global level, economists expect inflation to rise by 0.6% to 4.7% this year before decreasing to 3.9% next year, still above its long-term average. The group specifically noted that the disinflation trend that began in 2024 has lost momentum.4
- While the United States faces less than favorable demographics with a a working age population that is forecasted to shrink over the next 10 years, capital spending from the AI infrastructure buildout has been able to keep the economy growing and the labor market tight during this growth cycle.
- Small cap stocks in the United States continued to be some of the strongest performers of the quarter, up 6.4% and up nearly 24% for the year.5
- Non-US developed markets stocks rebounded from a negative first quarter, up 10.8% in the second quarter. The US Dollar was little changed, resulting in local currency returns being very close to dollar denominated returns.6
- Emerging Markets equities continue to be the top regional performers. The index was up over 24% in the second quarter.7
- U.S investment grade bonds erased the modest loss posted in the first quarter and were up 0.7% in the second quarter as inflation concerns waned.8
- Municipal bonds had a very strong quarter, up 2.3%, after struggling in 2025 due to supply and demand dynamics that put pressure on prices.9
Global Asset Class Returns
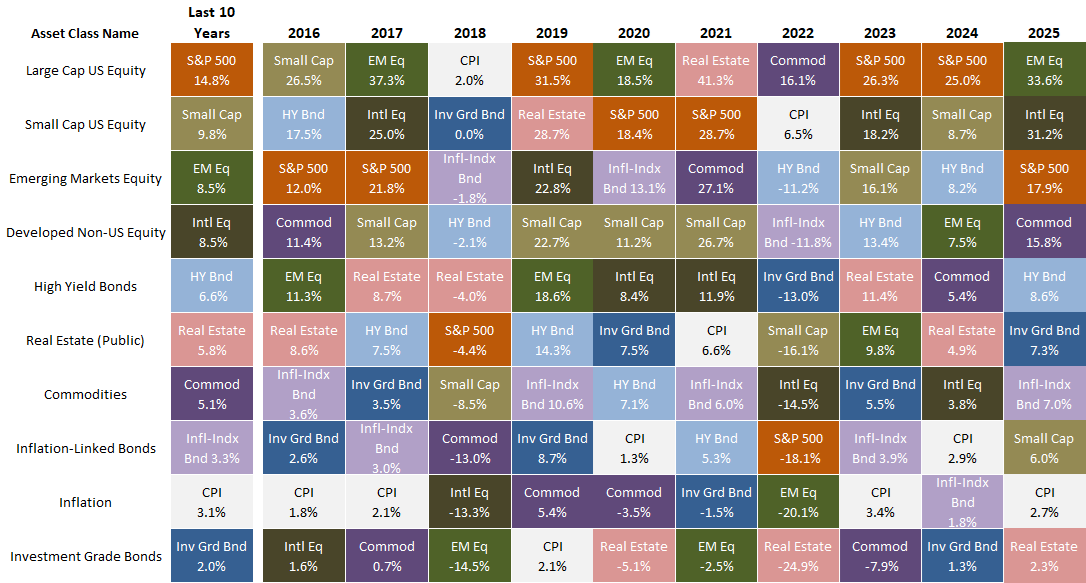
Returns are arranged in columns, by year. Each color represents a different asset class. Each year, the leaders and laggards tend to shift. Diversification across a range of asset classes can smooth returns and enhance growth.
- We maintain our neutral duration position in fixed income portfolios as interest rates have risen to levels closer to historical averages.
- We maintain our neutral allocation to emerging market equities.
- We maintain a neutral exposure in large-cap US equities within a global portfolio.
- After a strong first half of 2026, we have sold our position in small and mid-cap equities in the United States.
- We favor lower priced, value-oriented equities, both in the US and abroad, which tend to outperform the broad market over time with less volatility. We are optimistic about their return potential going forward.
We continue to focus our efforts on helping you meet your financial objectives by following our disciplined investment approach. Our approach uses return and risk models, incorporating fundamental valuations and tax-efficient strategies. This investment discipline is tailored to your individual situation in our continuing effort to craft and implement your customized investment solution.
As always, we thank you for placing your trust in our investment management and advice and welcome your questions and comments at any time.
Peter & Tom
Endnotes and Sources:
Text:
- NYM: WTI Crude Price Continuous contract in USD as of 6/30/2026.
- Morningstar: MSCI ACWI 3/31/2026 - 6/30/2026.
- JP Morgan Asset Management, Standard & Poor's: Magnificent 7 includes AAPL, AMZN, GOOGL/GOOG, META MSFT, NVDA and tsla. The S&P 500 ex-Mag 7 (S&P 493) is calculated by backing out a weighted average Magnificent 7 price return from the S&P 500 price return. As of 6/30/2026.
- IMF World Economic Outlook Update: July 2026.
- Morningstar: S&P SmallCap 600 TR USD: 3/31/2026 - 6/30/2026. 12/31/2025 - 6/30/2026.
- Morningstar: MSCI EAFE. 3/31/2026 - 6/30/2026.
- Morningstar: MSCI Emerging Markets NR USD. 3/31/2026 - 6/30/2026.
- Morningstar: Bloomberg US Aggregate Bond Index. 3/31/2026 - 6/30/2026.
- Morningstar:S&P AMT Free Municipal Bond Index. 3/31/2026 - 6/30/2026.
Charts:
The Impact of Strong Earnings Growth and Margin Expansion
Source: JP Morgan Asset Management, FactSet, Standard & Poor's, J.P. Morgan Asset Management.Historical EPS values are based on annual earnings per share. Forecasts for 2026, 2027 and 2028 reflect consensus analyst expectations, provided by FactSet. Past performance is no guarantee of future results. As of 6/30/2026.
Expected Market Returns and Risks, 7-10 Year Horizon: As of 6/30/2026.
Source: Stembrook Research.
(1) Volatility is measured in terms of Standard Deviation. Standard deviation is the statistical measurement of dispersion about an average, which depicts how widely a stock or portfolio’s returns varied over a certain period of time. Investors use the standard deviation of historical performance to try to predict the range of returns that is most likely for a given investment. When an investment has a high standard deviation, the predicted range of performance is wide, implying greater volatility. If an investment’s returns follow a normal distribution, then approximately 68 percent of the time they will fall within one standard deviation of the mean return of the investment, and 95 percent of the time within two standard deviations. For example, for a portfolio with a mean annual return of 10 percent and a standard deviation of two percent, you would expect the return to be between 8 and 12 percent about 68 percent of the time, and between 6 and 14 percent about 95 percent of the time. Source: Morningstar.
Historical Market Returns: As of 6/30/2026.
Source: Morningstar, Stembrook Research.
Indices: Bloomberg Barclays U.S Treasury Bills 1-3 Month Total Return, Bloomberg Barclays Municipal Bond 5 Year (4-6) Total Return, Bloomberg Barclays US Aggregate Bond Total Return, Bloomberg Barclays US Corporate High Yield Total Return, FTSE All Equity REIT Total Return, S&P 500 Composite Total Return, S&P SmallCap 600 Total Return, MSCI EAFE Total Return, MSCI EM (Emerging Markets) Total Return, Consumer Price Index – US, S&P 10 Year US TIPS Total Return, Bloomberg Commodity (Total Return) Index.
Yields Across Asset Classes: As of 6/30/206.
Sources: Cash Equivalents Yields since March 1976. Ibbotson, Federal Reserve Bank, Thomson Reuters, Municipal Bond Yields since March 1988. Barclays Capital, Charles Schwab, BofA Merrill Lynch, Standard & Poor's/Investortools Municipal Bond Indices, Investment Grade Bond Yields since March 1976. Barclays Capital, High Yield since December 1984. BofA Merrill Lynch, Barclays Capital, Real Estate (Public) Earnings Yield since March 1976. NAREIT all Equity, Large Cap US Equity Earnings Yield since March 1976. Standard & Poor's, BARRA, Mid Cap US Equity Earnings Yield since June 1991. Standard & Poor's, BARRA, Small Cap US Equity Earnings Yield since December 1993. Standard & Poor’s, BARRA, Developed Europe Equity Earnings Yield since March 1976. MSCI Europe, Standard & Poor's Europe 350, Developed Pacific Equity Earnings Yield since March 1976. MSCI Pacific, S&P/Citi PMI Asia Pacific, S&P Asia 50, Emerging Market Equity Earnings Yield since December 1998, Inflation-Linked Bond Real Yield to Maturity since March 1997. Citi Yield Book, Federal Reserve Bank. Note: Yields are not perfect predictors of future returns and should not be used in isolation.
Global Asset Class Returns: As of 12/31/2025.
Source: Thomson Reuters, Bloomberg, Morningstar, Stembrook Research.
Indices: Consumer Price Index – US, US 30-Day Treasury Bills, Bloomberg Barclays US Treasury Bills: 1-3 Month Index, Citigroup Inflation-Linked Index, S&P 10 Year US TIPS Index, Bloomberg Barclays US Aggregate Bond Index, BofA Merrill Lynch US High Yield Cash Pay, Bloomberg Barclays US Corporate High Yield Index, Dow Jones Wilshire REIT Index, FTSE All Equity REIT Index, S&P 500 Composite Total Return, S&P SmallCap 600 Total Return, MSCI EAFE Index, MSCI EM (Emerging Markets) Index, Dow Jones AIG Commodity (Totl Ret) Index, Bloomberg Commodity Index.
Disclosures
This material is intended to inform you of products and services offered by Stembrook Asset Management, LLC (“Stembrook”). Stembrook is a US Securities and Exchange Commission Registered Investment Advisor.
This material is not intended as an offer or solicitation for the purchase or sale of any financial instrument.
We believe the information contained in this material to be reliable but do not warrant its accuracy or completeness. The opinions, estimates, and investment strategies and views expressed in this document constitute the judgment of Stembrook, based on current market conditions and are subject to change without notice. The investment strategies stated here may differ from those expressed for other purposes or in other context.
Past performance is not indicative of future results.
The obligations and securities sold, offered, or recommended are not deposits and are not insured by the FDIC, the Federal Reserve Bank, or any governmental agency.
The views and strategies described herein may not be suitable for all investors. This material is presented with the understanding that it is not rendering accounting, legal or tax advice. Please consult your legal or tax adviser concerning such matters.
Important note regarding Stembrook’s capital market expectations.
The capital market expectations developed by Stembrook Asset Management are estimates of both a central tendency of asset class behavior and a probable range of asset class behavior over a long-term horizon. These estimates are one of many inputs used in the portfolio construction process, and should not be used independently. These expectations should not be construed as the returns that will be achieved, but merely those that may be achieved if certain assumptions hold true. Also note that each client's portfolio may differ given specific goals and constraints applied to the portfolio construction process.
Additional information is available upon request.