

Stembrook Market Review - Second Quarter 2025
Market UpdatesAfter a tumultuous start to the quarter following the April 4th announcement of sweeping tariffs levied by the U.S. across its trade partners, stocks eventually settled and finished the quarter in positive territory. After the initial announcement, tariffs were eventually negotiated to lower rates or delayed to allow further time for negotiation. According to the Yale Budget Lab, aggregate tariffs levied by the U.S. amongst its trading partners currently balance out to 19.7%.1 While this is not inconsequential, it is considerably lower than what had originally been presented by the White House on April 4th, which subsequently sent markets into a tailspin and shifted economists forecasts to an impending recession. Currently, tariffs are at their highest levels since 1933 (following the Smoot-Hawley Tariff Act), and are expected to put upward pressure on inflation and ultimately, slow economic activity.
Across the board, stocks delivered positive returns in the second quarter of 2025. Non-U.S stocks continued to lead the way, up 12% in the quarter, and are up 15.3% for the year.2 A portion of this return has been enhanced by U.S. Dollar weakness. In local terms, Non-U.S. stock are up 7.8%,3 still outpacing the 6.2%4 return of the S&P 500 for the first 6 months of 2025. Year-to-date, the dollar has fallen by 10% versus other major currencies and has dropped by 14% since its most recent peak in September of 2022 (see chart titled "Dollar Fluctuations Over Time" below). This follows a 14-year bull market in the Dollar that began in March 2008.5 Over this period of time, a stronger Dollar helped U.S.-based assets on a relative return basis versus non-U.S. assets. Whether or not this reversal in the strength of the dollar continues remains to be seen. A growing deficit and debt in the U.S., combined with less than favorable trade policies and the return of positive interest rates outside of the U.S. may continue to put downward pressure on the Dollar.
Dollar Fluctuations Over Time
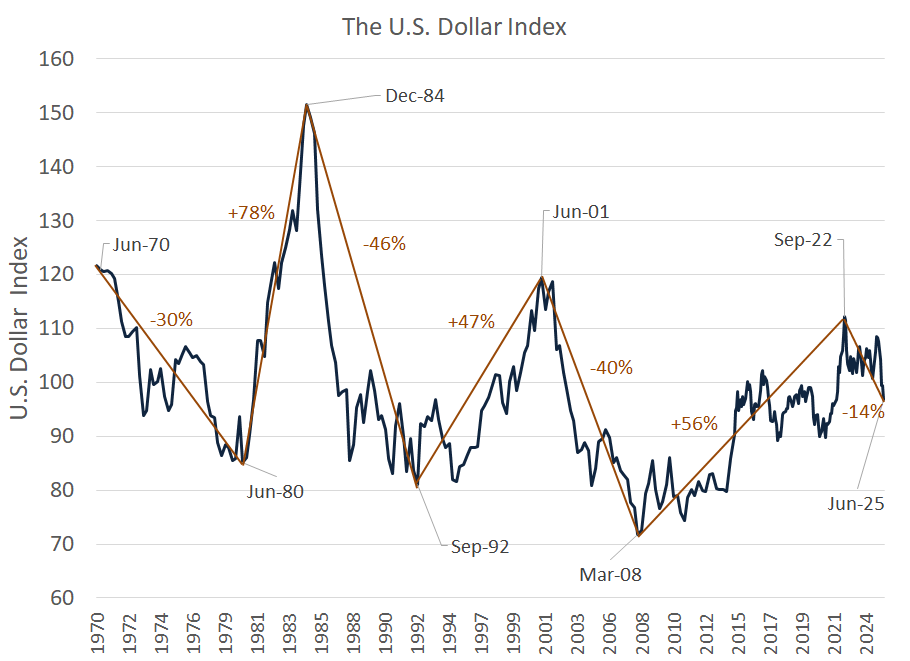 Following a 14-year period of Dollar appreciation, the dollar has begun to fall in value.
Our proprietary models forecast long-term, pre-tax returns ranging from 3% to 5% for fixed income-like asset classes and 9% to 10% for equity-like asset classes (see Expected Market Returns and Risks table). Our more detailed observations and current portfolio positioning are outlined in the following comments.
Expected Market Returns and Risks 7-10 Year Horizon
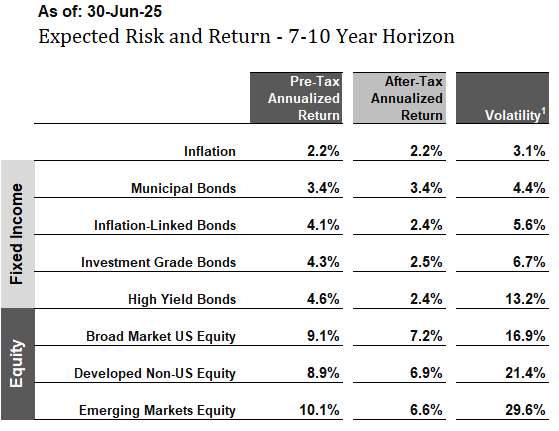
A sampling of return expectations produced by our models. Expected returns are projections and are not guaranteed.
Historical Market Returns
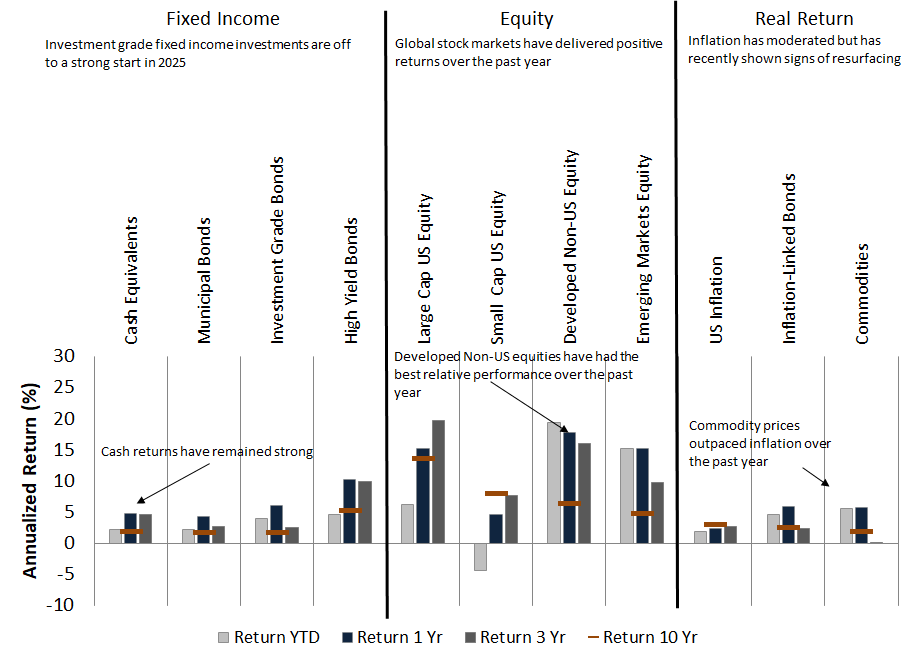 Historical market returns as of June 30th 2025. Note that looking backwards at recent returns is not a reliable method of predicting future returns.
Yields Across Asset Classes
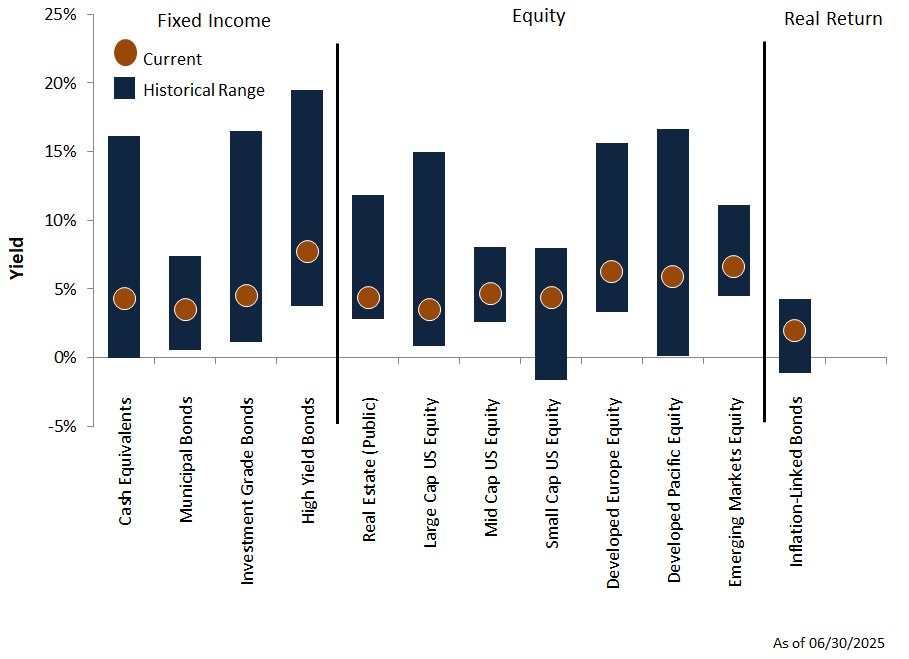 Yields are an indicator of future returns. Orange dots show current yields, blue bars show historical ranges.
Economic Backdrop
- Citing tariffs and trade disruption, the IMF downgraded global growth forecasts for the coming years. In their April 2025 update, the IMF forecasted that world economic output would slow to a 2.8% annualized pace this year, adjusted for inflation. Economists expect growth to tick up slightly to 3.0% in 2026.6
- After the weakest quarter since the pandemic, economists expect slower growth in the United States, with annualized real GDP growth dropping by 1% to 1.8% this year and 1.7% in 2026. Similar levels of growth are expected in other advanced economies.6
- Emerging economies are expected to have slower growth in the coming years as well, with GDP falling to 3.7% this year, followed by a slight uptick to 3.9% next year.6
- While still elevated, global inflation is expected to continue moderating in 2025 to 4.3% and 3.6% in 2026.6
- U.S. inflation ticked up slightly higher once again. CPI was up 0.9% in the second quarter, but remains at a below-average level of 2.7% over the trailing 12 months.7 Market participants and economists will be keeping an eye on the impact of tariffs on inflation in the coming months.
- While the odds have been shifting lower due to inflation concerns, economists expect the Federal Reserve to cut interest rates two times before the end of the year, ultimately reducing the Fed Funds Rate by 0.5% (the current range of rates is between 4.25% and 4.5%). The Fed's ultimate goal is to maintain this rate at 2% with inflation at the same level. Current forecasts have the Fed arriving at this target rate in 2027.
- As mentioned in our opening comments, despite a slow start and shocks from tariff announcements, global stocks are off to a strong start in 2025, up 10.1%.8
- Non-U.S. stocks have led the way this year and tacked on another 12% in the quarter.9
- Despite geopolitical tensions, Emerging Markets equities continued to deliver strong returns, also up 12% in the quarter.10
- Small cap stocks in the U.S continue to trail both large cap stocks domestically and abroad, but still delivered positive returns in the quarter, up 4.9%.11
- Investment grade bonds continued to maintain gains within the range of their yields, up 1.2% in the quarter.12
- Demand for non-U.S. bonds drove global bond prices up 7.4% over the last 3 months.13
- Municipal bonds continue to trail the returns of corporates and treasuries. Munis were up 0.6% in the quarter. A portion of this underperformance was attributable to an auction in April that created a supply and demand mismatch. This happened at the same time markets were fluctuating as they digested the news of the tariff rollout.
Global Asset Class Returns

Returns are arranged in columns, by year. Each color represents a different asset class. Each year, the leaders and laggards tend to shift. Diversification across a range of asset classes can smooth returns and enhance growth.
- We maintain our neutral duration position in fixed income portfolios as interest rates have risen to levels closer to historical averages.
- We maintain our neutral allocation to emerging market equities.
- We maintain a neutral exposure in large-cap U.S. equities.
- We favor lower priced, value-oriented equities, both in the U.S. and abroad, which tend to outperform the broad market over time, with less volatility. While these stocks did not keep pace with some of the tech-oriented growth names in 2024, they have outperformed in the first half of 2025. We are optimistic about their return potential going forward.
We continue to focus our efforts on helping you meet your financial objectives by following our disciplined investment approach. Our approach uses return and risk models, incorporating fundamental valuations and tax-efficient strategies. This investment discipline is tailored to your individual situation in our continuing effort to craft and implement your customized investment solution.
We are in the process of reviewing the tax implications of the One Big Beautiful Bill Act and will suggest adjustments to client plans in consultation with your tax advisor, where appropriate.
As always, we thank you for placing your trust in our investment management and advice and welcome your questions and comments at any time.
Peter & Tom
Endnotes and Sources:
Text:
- Yale Budget Lab. https://budgetlab.yale.edu/research/state-us-tariffs-july-14-2025
- Morningstar: MSCI EAFE NR USD. 3/31/2025 - 6/30/2025, 12/31/2024 - 6/30/2025.
- Morningstar: MSCI EAFE NR LCL. 12/31/2024 - 6/30/2025.
- Morningstar: S&P 500 TR. 12/31/2024 - 6/30/2025.
- Morningstar: $DXY—U.S. Dollar Index. 3/31/2008 -6/30/2025.
- IMF World Economic Outlook Update: April 2025.
- Bureau of Labor Statistics: CPI For All Urban Consumers 6/30/2025.
- Morningstar: MSCI ACWI NR USD. 12/31/2024 - 6/30/2025.
- Morningstar: MSCI ACWI Ex USA NR USD. 3/31/2025 - 6/30/2025.
- Morningstar: MSCI ACWI Emerging Markets NR USD. 3/31/2025 - 6/30/2025.
- Morningstar: S&P SmallCap 600. 3/31/2025 - 6/30/2025.
- Morningstar: Bloomberg US Aggregate Bond Index. 3/31/2025 - 6/30/2025.
- Morningstar. FTSE WGBI NonUSD USD. 3/31/2025 - 6/30/2025.
- Morningstar: S&P National AMT Free Muni TR USD. 3/31/2025 - 6/30/2025.
Charts:
Dollar Fluctuations Over Time
Source:$DXY—U.S. Dollar Index. 6/30/1970- 6/30/2025. Bloomberg, Yahoo Finance, J.P. Morgan Asset Management, Stembrook Research.
Expected Market Returns and Risks, 7-10 Year Horizon: As of 6/30/2025.
Source: Stembrook Research.
(1) Volatility is measured in terms of Standard Deviation. Standard deviation is the statistical measurement of dispersion about an average, which depicts how widely a stock or portfolio’s returns varied over a certain period of time. Investors use the standard deviation of historical performance to try to predict the range of returns that is most likely for a given investment. When an investment has a high standard deviation, the predicted range of performance is wide, implying greater volatility. If an investment’s returns follow a normal distribution, then approximately 68 percent of the time they will fall within one standard deviation of the mean return of the investment, and 95 percent of the time within two standard deviations. For example, for a portfolio with a mean annual return of 10 percent and a standard deviation of two percent, you would expect the return to be between 8 and 12 percent about 68 percent of the time, and between 6 and 14 percent about 95 percent of the time. Source: Morningstar.
Historical Market Returns: As of 6/30/2025.
Source: Morningstar, Stembrook Research.
Indices: Bloomberg Barclays U.S Treasury Bills 1-3 Month Total Return, Bloomberg Barclays Municipal Bond 5 Year (4-6) Total Return, Bloomberg Barclays U.S. Aggregate Bond Total Return, Bloomberg Barclays U.S. Corporate High Yield Total Return, FTSE All Equity REIT Total Return, S&P 500 Composite Total Return, S&P SmallCap 600 Total Return, MSCI EAFE Total Return, MSCI EM (Emerging Markets) Total Return, Consumer Price Index – U.S., S&P 10 Year U.S. TIPS Total Return, Bloomberg Commodity (Total Return) Index.
Yields Across Asset Classes: As of 6/30/2025.
Sources: Cash Equivalents Yields since March 1976. Ibbotson, Federal Reserve Bank, Thomson Reuters, Municipal Bond Yields since March 1988. Barclays Capital, Charles Schwab, BofA Merrill Lynch, Standard & Poor's/Investortools Municipal Bond Indices, Investment Grade Bond Yields since March 1976. Barclays Capital, High Yield since December 1984. BofA Merrill Lynch, Barclays Capital, Real Estate (Public) Earnings Yield since March 1976. NAREIT all Equity, Large Cap U.S. Equity Earnings Yield since March 1976. Standard & Poor's, BARRA, Mid Cap U.S. Equity Earnings Yield since June 1991. Standard & Poor's, BARRA, Small Cap U.S. Equity Earnings Yield since December 1993. Standard & Poor’s, BARRA, Developed Europe Equity Earnings Yield since March 1976. MSCI Europe, Standard & Poor's Europe 350, Developed Pacific Equity Earnings Yield since March 1976. MSCI Pacific, S&P/Citi PMI Asia Pacific, S&P Asia 50, Emerging Market Equity Earnings Yield since December 1998, Inflation-Linked Bond Real Yield to Maturity since March 1997. Citi Yield Book, Federal Reserve Bank. Note: Yields are not perfect predictors of future returns and should not be used in isolation.
Global Asset Class Returns: As of 12/31/2024.
Source: Thomson Reuters, Bloomberg, Morningstar, Stembrook Research.
Indices: Consumer Price Index – US, U.S. 30-Day Treasury Bills, Bloomberg Barclays U.S. Treasury Bills: 1-3 Month Index, Citigroup Inflation-Linked Index, S&P 10 Year US TIPS Index, Bloomberg Barclays U.S. Aggregate Bond Index, BofA Merrill Lynch U.S. High Yield Cash Pay, Bloomberg Barclays U.S. Corporate High Yield Index, Dow Jones Wilshire REIT Index, FTSE All Equity REIT Index, S&P 500 Composite Total Return, S&P SmallCap 600 Total Return, MSCI EAFE Index, MSCI EM (Emerging Markets) Index, Dow Jones AIG Commodity (Totl Ret) Index, Bloomberg Commodity Index.
Disclosures
This material is intended to inform you of products and services offered by Stembrook Asset Management, LLC (“Stembrook”). Stembrook is a U.S. Securities and Exchange Commission Registered Investment Advisor.
This material is not intended as an offer or solicitation for the purchase or sale of any financial instrument.
We believe the information contained in this material to be reliable but do not warrant its accuracy or completeness. The opinions, estimates, and investment strategies and views expressed in this document constitute the judgment of Stembrook, based on current market conditions and are subject to change without notice. The investment strategies stated here may differ from those expressed for other purposes or in other context.
Past performance is not indicative of future results.
The obligations and securities sold, offered, or recommended are not deposits and are not insured by the FDIC, the Federal Reserve Bank, or any governmental agency.
The views and strategies described herein may not be suitable for all investors. This material is presented with the understanding that it is not rendering accounting, legal or tax advice. Please consult your legal or tax adviser concerning such matters.
Important note regarding Stembrook’s capital market expectations.
The capital market expectations developed by Stembrook Asset Management are estimates of both a central tendency of asset class behavior and a probable range of asset class behavior over a long-term horizon. These estimates are one of many inputs used in the portfolio construction process, and should not be used independently. These expectations should not be construed as the returns that will be achieved, but merely those that may be achieved if certain assumptions hold true. Also note that each client's portfolio may differ given specific goals and constraints applied to the portfolio construction process.
Additional information is available upon request.