

Stembrook Market Review - Fourth Quarter 2025
Market UpdatesDespite headlines and points of concern in global markets and the economy, global equity markets, once again, had a very strong year from a performance perspective, up 22.3%.1 While underperforming both developed international and Emerging Markets equities, US large cap stocks were up 17.9%2, the third consecutive year with double digit returns. Large cap stocks in the US have exhibited double-digit, above average returns in 8 out of the last 10 calendar years. As previously mentioned, 2025 was a particularly strong year for Non-US stocks. Eurozone stocks led the way, up 41.3%3, followed by a return of over 34% in Emerging Markets stocks.4
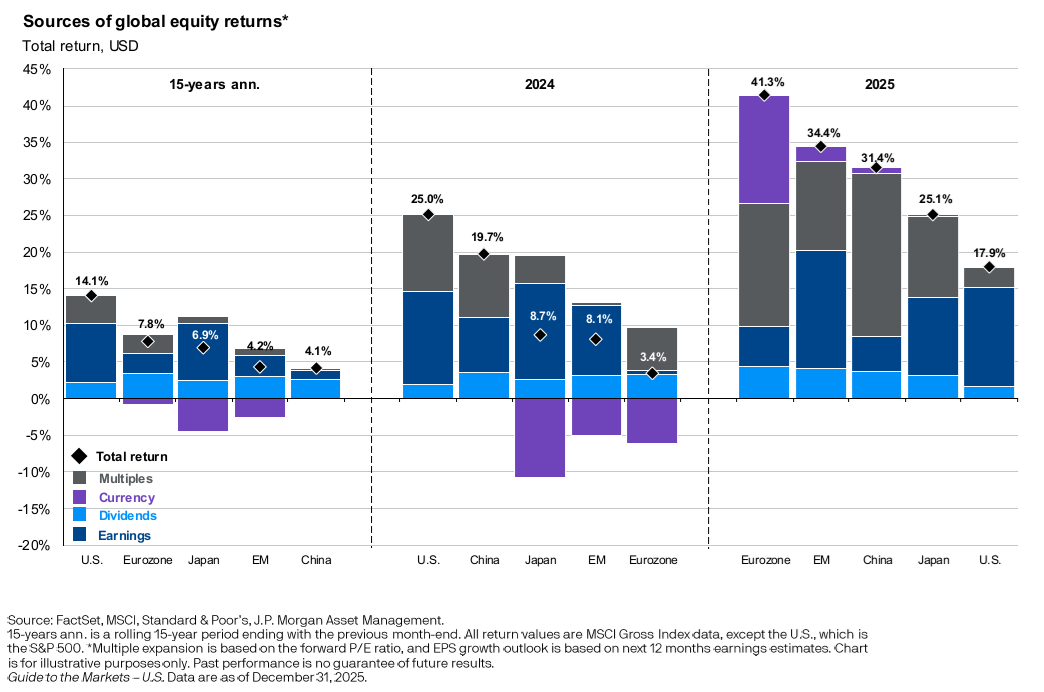
The chart below, titled Global Equity Return Composition, outlines the components of return across global equity markets over the last two years and compares them to the 15-year average. The first thing we will point out is that earnings growth was stronger than average in all regions sampled in 2025. In addition, multiple expansion was, in most cases, the largest contributor to strong performance in 2025. An increase in the price-to-earnings ratio is an example of multiple expansion. When this number is increasing, the price of the stock (the numerator) is increasing at a faster rate than earnings (the denominator). While this has been a significant contributor to return in US markets, it has been lacking in non-US markets for a number of years. In addition, currency contributed to better relative returns for non-US markets. where it had been a detractor in 2024 and over the last 15 years, as the value of the US Dollar compared to other major currencies had increased. The Dollar fell by 9% in 2025 versus other major currencies, with much of the price change coming early in the year.5
Global Equity Return Composition
Our proprietary models forecast long-term, pre-tax returns ranging from 3% to 4% for fixed income-like asset classes and 9% to 10% for equity-like asset classes (see Expected Market Returns and Risks table). Our more detailed observations and current portfolio positioning are outlined in the following comments.
Expected Market Returns and Risks 7-10 Year Horizon
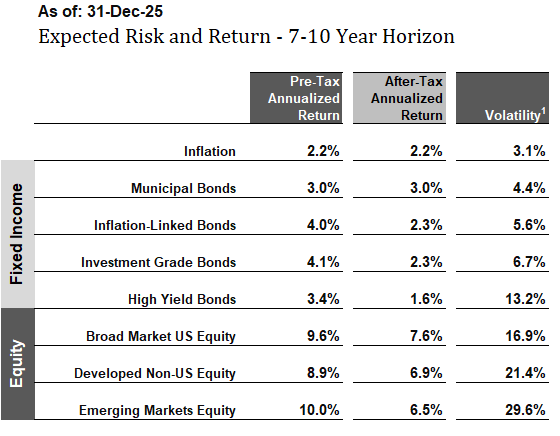
A sampling of return expectations produced by our models. Expected returns are projections and are not guaranteed.
Historical Market Returns
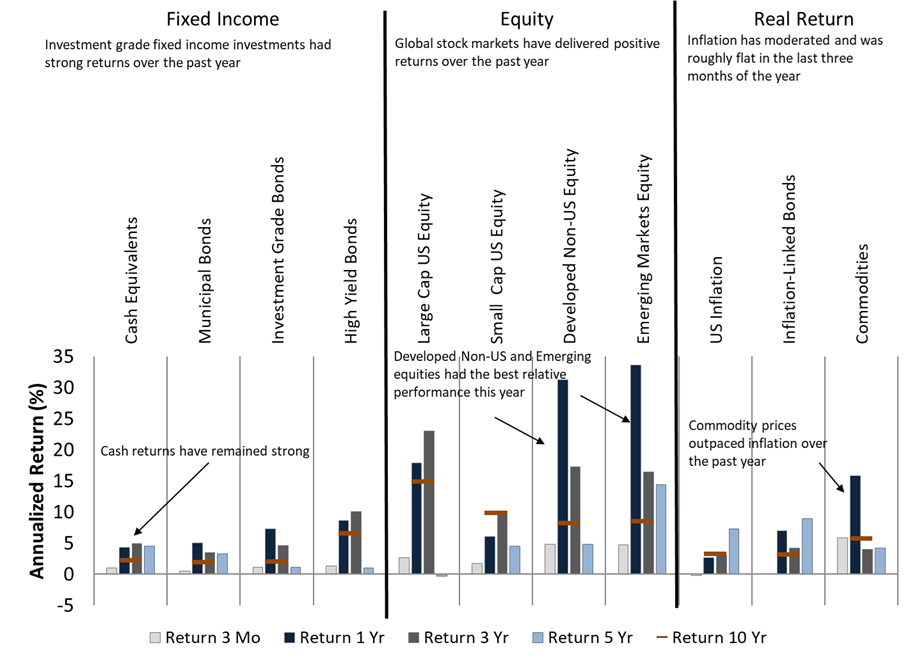 Historical market returns as of December 31st 2025. Note that looking backwards at recent returns is not a reliable method of predicting future returns.
Yields Across Asset Classes
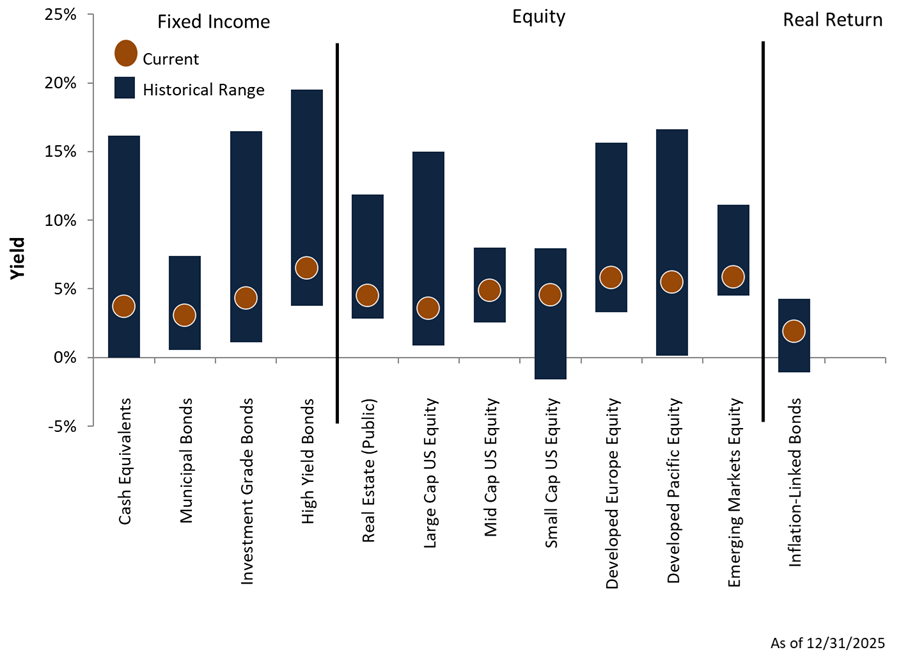 Yields are an indicator of future returns. Orange dots show current yields, blue bars show historical ranges.
Economic Backdrop
- The global economy grew at a 3.2% annual pace in 2025, according to the IMF. This pace of growth exceeded the 2.8% growth projections that had been forecasted in April. Economists expect 3.1% economic growth in 2026.6
- The IMF expects US economic growth to accelerate from a 2.0% annualized pace in 2025, to a 2.1% annualized pace in 2026. While this level of growth is not exceptional, it exceeds the average growth rate for all advanced economies.6
- Economic growth in Emerging Economies ticked down slightly in 2025 to 4.2%. The IMF expects the group to decelerate once again to 4.0% growth in 2026.6 India and China continue to produce the most economic activity out of this group.
- Remaining elevated, global inflation stood at 4.2% in 2025, a 1.6% decline from the previous year. Lower inflation is expected to persist with the expected rate of inflation forecasted to fall to 3.7%.6
- As mentioned in our opening comments, stocks continue to deliver excellent returns. The US economy, while certainly not booming, is still making forward progress. Consumer confidence in the United States continues to lag. The long-term average for the index since 1971 is 77.5. As of December 2025, the index sits at a depressed level of 52.9 and has only exceeded its long-term average once in the past 5-years (in April of 20217). Economists attribute of this lack of confidence to the so called "K-shaped" economy; an environment where higher earners and those that can leverage technology have fared significantly better than those in industries facing technological headwinds. The latter are more exposed to the damaging impact of inflation since a larger portion of income is spent on day-to-day expenses and less is saved and invested.
- Non-US stocks significantly outperformed US stocks. Stocks outside of the US ended the year up 33.1% adjusted for the fluctuation in the US Dollar and up 25.1% in local terms.8
- The tech-heavy NASDAQ index drove positive returns in the US, up 21% for the year.9
- Mid-cap stocks posted the weakest returns by market cap within the US, but still had a positive year, up 9.6%.10
- Lower interest rates made it a lucrative year for bond investors in the United States. Investment grade bonds finished the year up 7.3%.11
- Having struggled in the first 2 quarters of the year, municipal bonds rebounded and finished the year up 4.3%.12
- Interest rates fell across the yield curve, but moves were more pronounced on the short end of the curve as the Fed lowered rates. Market participants expect at least 2 more rate cuts in 2026, but much of this is in flux as the Federal Reserve Board will have a new chairperson this spring and inflation still shows signs of resurfacing.
Global Asset Class Returns
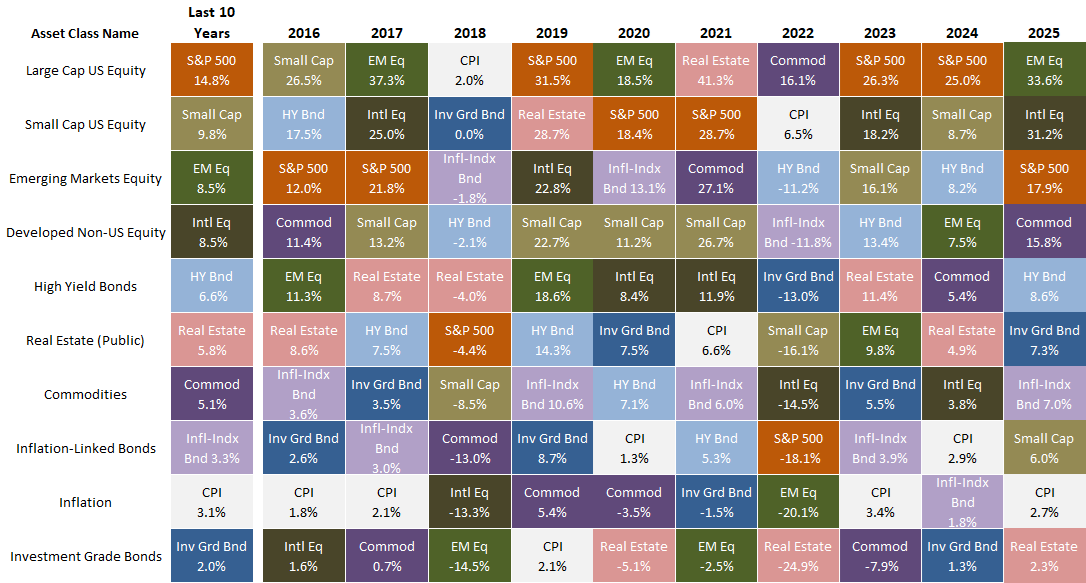
Returns are arranged in columns, by year. Each color represents a different asset class. Each year, the leaders and laggards tend to shift. Diversification across a range of asset classes can smooth returns and enhance growth.
- We maintain our neutral duration position in fixed income portfolios as interest rates have risen to levels closer to historical averages.
- We maintain our neutral allocation to emerging market equities.
- We maintain a neutral exposure in large-cap U.S. equities within a global portfolio.
- We favor lower priced, value-oriented equities, both in the U.S. and abroad, which tend to outperform the broad market over time, with less volatility. We are optimistic about their return potential going forward.
We continue to focus our efforts on helping you meet your financial objectives by following our disciplined investment approach. Our approach uses return and risk models, incorporating fundamental valuations and tax-efficient strategies. This investment discipline is tailored to your individual situation in our continuing effort to craft and implement your customized investment solution.
As we approach the tax filing deadline, please do not hesitate to reach out if you or your tax advisor have any questions. In addition, you have until your tax filing date to make a contribution to your IRA or Roth IRA for the 2025 tax year. If you would like to discuss this, please reach out to either of us.
As always, we thank you for placing your trust in our investment management and advice and welcome your questions and comments at any time.
Peter & Tom
Endnotes and Sources:
Text:
- Morningstar: MSCI ACWI NR USD. 12/31/2024 - 12/31/2025.
- Morningstar: S&P 500 TR. 12/31/2024 - 12/31/2025.
- Morningstar: MSCI ACWI Europe NR USD. 12/31/2024 - 12/31/2025.
- Morningstar: MSCI Emerging Markets NR USD. 12/31/2024 - 12/31/2025.
- Morningstar: $DXY—U.S. Dollar Index. 12/31/2024 - 12/31/2025.
- IMF World Economic Outlook Update: October 2026.
- University of Michigan: Consumer Confidence 1971 - 2025.
- Morningstar: MSCI AC World ex-US NR USD and LCL. 12/31/2024 - 12/31/2025.
- Morningstar: NASDAQ 100 TR. 12/31/2024 - 12/31/2025.
- Morningstar: S&P 400 TR. 12/31/2024 - 12/31/2025.
- Morningstar: Bloomberg US Aggregate Bond Index. 12/31/2024 - 12/31/2025.
-
Morningstar: S&P National AMT Free Muni TR USD. 12/31/2024 - 12/31/2025.
Charts:
Global Return Composition
Source: JP Morgan Asset Management
Expected Market Returns and Risks, 7-10 Year Horizon: As of 12/31/2025.
Source: Stembrook Research.
(1) Volatility is measured in terms of Standard Deviation. Standard deviation is the statistical measurement of dispersion about an average, which depicts how widely a stock or portfolio’s returns varied over a certain period of time. Investors use the standard deviation of historical performance to try to predict the range of returns that is most likely for a given investment. When an investment has a high standard deviation, the predicted range of performance is wide, implying greater volatility. If an investment’s returns follow a normal distribution, then approximately 68 percent of the time they will fall within one standard deviation of the mean return of the investment, and 95 percent of the time within two standard deviations. For example, for a portfolio with a mean annual return of 10 percent and a standard deviation of two percent, you would expect the return to be between 8 and 12 percent about 68 percent of the time, and between 6 and 14 percent about 95 percent of the time. Source: Morningstar.
Historical Market Returns: As of 12/31/2025.
Source: Morningstar, Stembrook Research.
Indices: Bloomberg Barclays U.S Treasury Bills 1-3 Month Total Return, Bloomberg Barclays Municipal Bond 5 Year (4-6) Total Return, Bloomberg Barclays U.S. Aggregate Bond Total Return, Bloomberg Barclays U.S. Corporate High Yield Total Return, FTSE All Equity REIT Total Return, S&P 500 Composite Total Return, S&P SmallCap 600 Total Return, MSCI EAFE Total Return, MSCI EM (Emerging Markets) Total Return, Consumer Price Index – U.S., S&P 10 Year U.S. TIPS Total Return, Bloomberg Commodity (Total Return) Index.
Yields Across Asset Classes: As of 12/31/2025.
Sources: Cash Equivalents Yields since March 1976. Ibbotson, Federal Reserve Bank, Thomson Reuters, Municipal Bond Yields since March 1988. Barclays Capital, Charles Schwab, BofA Merrill Lynch, Standard & Poor's/Investortools Municipal Bond Indices, Investment Grade Bond Yields since March 1976. Barclays Capital, High Yield since December 1984. BofA Merrill Lynch, Barclays Capital, Real Estate (Public) Earnings Yield since March 1976. NAREIT all Equity, Large Cap U.S. Equity Earnings Yield since March 1976. Standard & Poor's, BARRA, Mid Cap U.S. Equity Earnings Yield since June 1991. Standard & Poor's, BARRA, Small Cap U.S. Equity Earnings Yield since December 1993. Standard & Poor’s, BARRA, Developed Europe Equity Earnings Yield since March 1976. MSCI Europe, Standard & Poor's Europe 350, Developed Pacific Equity Earnings Yield since March 1976. MSCI Pacific, S&P/Citi PMI Asia Pacific, S&P Asia 50, Emerging Market Equity Earnings Yield since December 1998, Inflation-Linked Bond Real Yield to Maturity since March 1997. Citi Yield Book, Federal Reserve Bank. Note: Yields are not perfect predictors of future returns and should not be used in isolation.
Global Asset Class Returns: As of 12/31/2025.
Source: Thomson Reuters, Bloomberg, Morningstar, Stembrook Research.
Indices: Consumer Price Index – US, U.S. 30-Day Treasury Bills, Bloomberg Barclays U.S. Treasury Bills: 1-3 Month Index, Citigroup Inflation-Linked Index, S&P 10 Year US TIPS Index, Bloomberg Barclays U.S. Aggregate Bond Index, BofA Merrill Lynch U.S. High Yield Cash Pay, Bloomberg Barclays U.S. Corporate High Yield Index, Dow Jones Wilshire REIT Index, FTSE All Equity REIT Index, S&P 500 Composite Total Return, S&P SmallCap 600 Total Return, MSCI EAFE Index, MSCI EM (Emerging Markets) Index, Dow Jones AIG Commodity (Totl Ret) Index, Bloomberg Commodity Index.
Disclosures
This material is intended to inform you of products and services offered by Stembrook Asset Management, LLC (“Stembrook”). Stembrook is a U.S. Securities and Exchange Commission Registered Investment Advisor.
This material is not intended as an offer or solicitation for the purchase or sale of any financial instrument.
We believe the information contained in this material to be reliable but do not warrant its accuracy or completeness. The opinions, estimates, and investment strategies and views expressed in this document constitute the judgment of Stembrook, based on current market conditions and are subject to change without notice. The investment strategies stated here may differ from those expressed for other purposes or in other context.
Past performance is not indicative of future results.
The obligations and securities sold, offered, or recommended are not deposits and are not insured by the FDIC, the Federal Reserve Bank, or any governmental agency.
The views and strategies described herein may not be suitable for all investors. This material is presented with the understanding that it is not rendering accounting, legal or tax advice. Please consult your legal or tax adviser concerning such matters.
Important note regarding Stembrook’s capital market expectations.
The capital market expectations developed by Stembrook Asset Management are estimates of both a central tendency of asset class behavior and a probable range of asset class behavior over a long-term horizon. These estimates are one of many inputs used in the portfolio construction process, and should not be used independently. These expectations should not be construed as the returns that will be achieved, but merely those that may be achieved if certain assumptions hold true. Also note that each client's portfolio may differ given specific goals and constraints applied to the portfolio construction process.
Additional information is available upon request.