

Stembrook Market Review - First Quarter 2026
Market UpdatesOn the heels of a very strong 2025 for both equity and bond investors, the first quarter of 2026 presented investors with a more challenging landscape. Concerns mounted as the quarter progressed, starting with doubt about the stability of the less-liquid Private Credit market due to the asset class's exposure to the software industry. In addition, software stocks were under pressure from investors given concerns of Artificial Intelligence (AI) replacing traditional software. To cap off an already unstable start to the year the United States began its attack on Iraq on February 28th. The largest impact was in oil markets due to the blockage of the Strait of Hormuz, which would restrict oil shipments from the Middle East to world markets - predominantly Asian markets. Oil prices rallied to over $100 per barrel on the news after starting the year below $60. They remain elevated due to continued unrest in the region as there has not been a clear indication as to when the conflict might end. Stock prices were met with volatility as the VIX index, generally viewed as a gauge of investor fear in the market, went from 17.9 on February 25th, to a high of 31.1 on March 27th.1 Despite all of the concerns, the US stock market was only down -5% in the quarter, with the largest drawdown (peak to trough) being -9%. This is not an abnormal occurrence. Since 1980 the average peak to trough decline in the US market is -14.2% in a calendar year.2
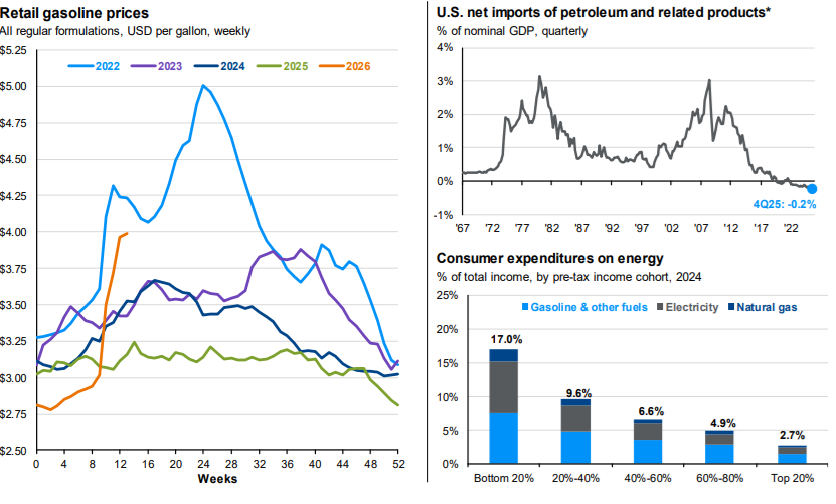
Since oil is a globally traded commodity, when there is pressure on oil prices in one part of the world, it affect's prices globally. Despite the US being a net exporter of petroleum-related products, meaning our country sells more oil and gas to the rest of the world than we buy, the global nature of the oil trade pushes up prices everywhere. The impact of higher oil prices has been the primary knock-on effect felt by the American consumer since the beginning of this conflict. While this impacts all consumers, it has the most profound impact on lower income earners and is estimated to account for 17% of their budget, as highlighted in the chart below. While not at an all-time high, gasoline prices remain elevated. The longer that prices stay high, the larger the impact on inflation and the risk spillover to the broader economy. It is difficult to gauge how long the conflict will last, but it is certainly something that we will be keeping an eye on.
The Impact of Oil Prices on the US Economy
Higher Gas Prices Across the Country
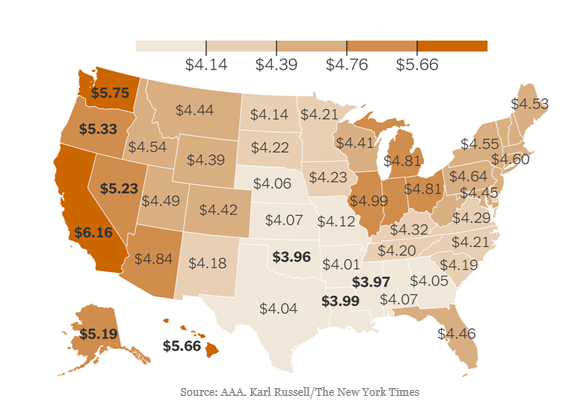 As of May 6th, the national average price of gasoline reached $4.56 per gallon.
Our proprietary models forecast long-term, pre-tax returns ranging from 3% to 4% for fixed income-like asset classes and 9% to 10% for equity-like asset classes (see Expected Market Returns and Risks table). More detailed observations and current portfolio positioning are outlined in the following comments.
Expected Market Returns and Risks 7-10 Year Horizon
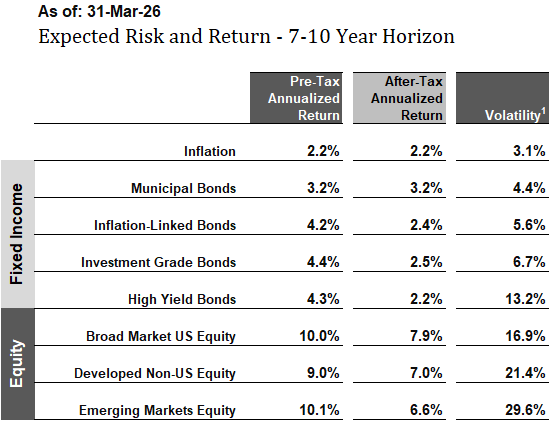
A sampling of return expectations produced by our models. Expected returns are projections and are not guaranteed.
Historical Market Returns
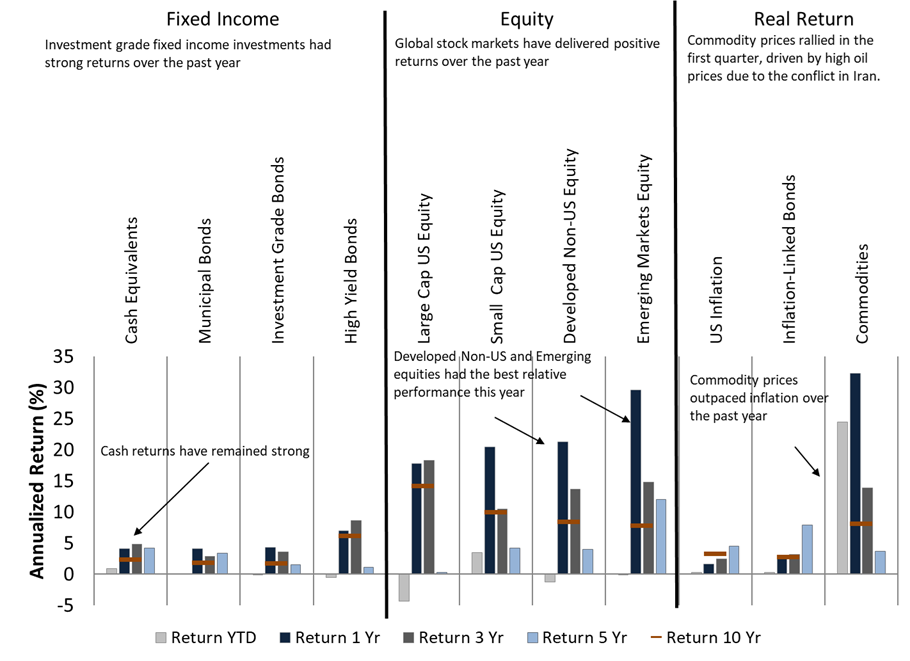 Historical market returns as of March 31st, 2026. Note that looking backwards at recent returns is not a reliable method of predicting future returns.
Yields Across Asset Classes
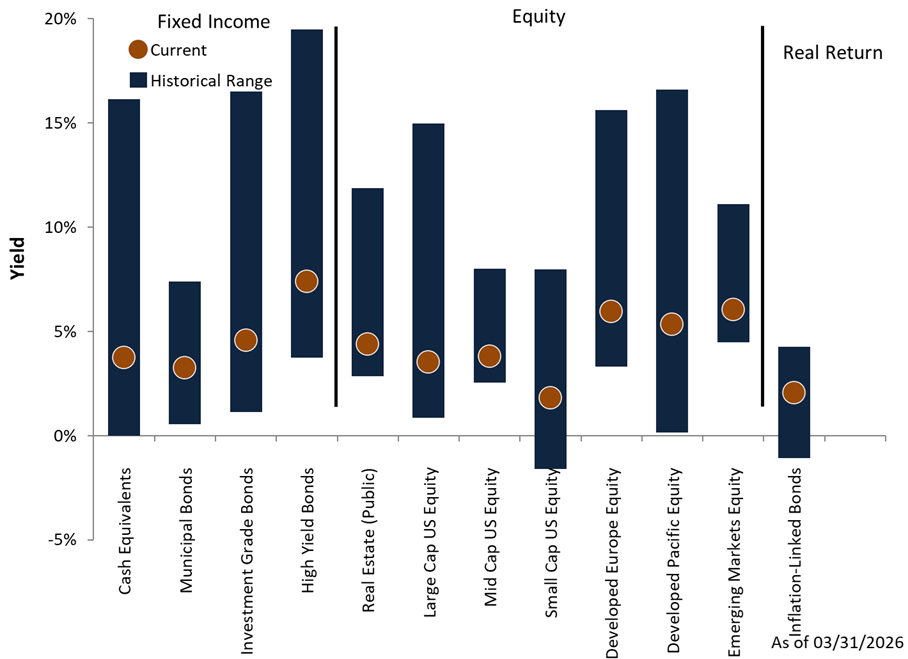 Yields are an indicator of future returns. Orange dots show current yields, blue bars show historical ranges.
Economic Backdrop
- Citing inflation concerns from higher energy prices, the IMF lowered its outlook for global growth to 3.1% for 2026 and expects growth to pick up modestly next year, given expectations of stronger economic data and reductions in tariffs.3
- Consistent with their forecast for other advanced economies, the IMF expects economic growth in the United States to decelerate to 2.3% this year, with modest decreases over the following two years due, in part, to higher energy prices.3
- Emerging economies are also expected to see a deceleration in growth, dropping below 4.0% to 3.9% in 2026, followed by a modest uptick next year, with continued strength in Asian markets.3
- Consistent with headlines of higher energy prices, the IMF expects inflation to increase to 3.2% for the US in 2026. However, the forecast for the following years reflects a level closer to the 2.0 % historical average.3
- Consumer confidence fell to its lowest level since June of 2022 in the March release, citing concerns over the conflict in Iraq. The long-term average for the index is 77.4. After nearly reaching the average level in December 2024, it has fallen over the five subsequent quarters, to a level of 53.5.4
- Non-US stocks continued to produce returns in excess of US stocks to begin the year, falling only -0.6%5 in the quarter, while US stocks fell by -4.3%.6
- Emerging Markets Equities also had returns in excess of the US market, down by only -0.1% in the first quarter.7
- Within the US market, the tech-heavy Magnificent Seven stocks fell by -11%8 in the first quarter, while value stocks outperformed the index, up 2.1% in the quarter.9
- Small and mid-cap companies in the US were the bright spot in equity markets, both delivering modest positive returns.
- Interest rates rose on concerns of inflation, which put a damper on bond returns in the first quarter. Investment grade bonds fell by -0.5%.10
- Global bonds felt the pressure from higher interest rates, falling -1.7% in the first quarter.11
Global Asset Class Returns
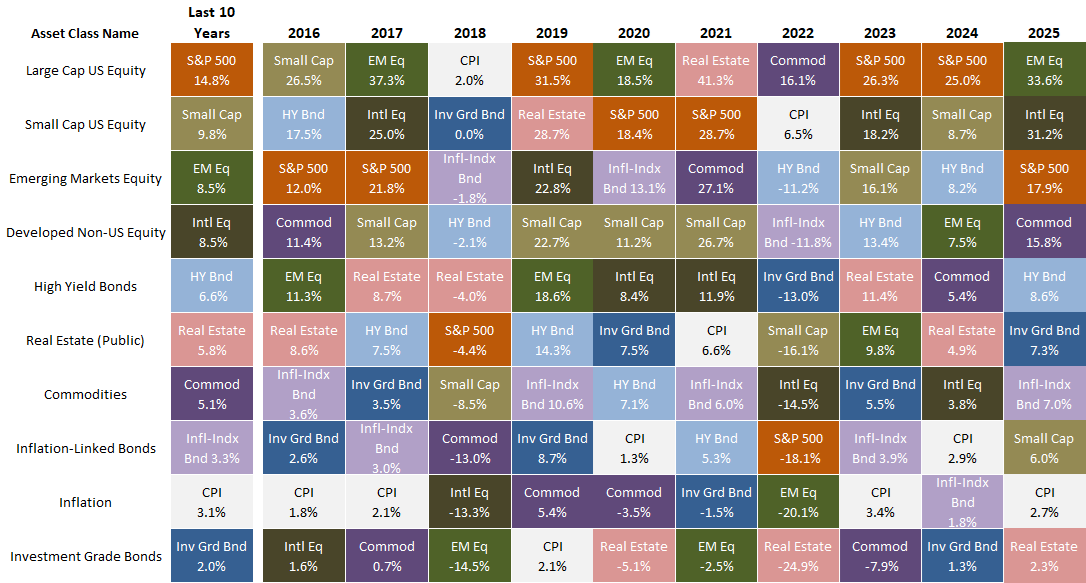
Returns are arranged in columns, by year. Each color represents a different asset class. Each year, the leaders and laggards tend to shift. Diversification across a range of asset classes can smooth returns and enhance growth.
- We maintain our neutral duration position in fixed income portfolios as interest rates have risen to levels closer to historical averages.
- We maintain our neutral allocation to emerging market equities.
- We maintain a neutral exposure in large-cap US equities within a global portfolio.
- We favor lower priced, value-oriented equities, both in the US and abroad, which tend to outperform the broad market over time with less volatility. We are optimistic about their return potential going forward.
We continue to focus our efforts on helping you meet your financial objectives by following our disciplined investment approach. Our approach uses return and risk models, incorporating fundamental valuations and tax-efficient strategies. This investment discipline is tailored to your individual situation in our continuing effort to craft and implement your customized investment solution.
As always, we thank you for placing your trust in our investment management and advice and welcome your questions and comments at any time.
Peter & Tom
Endnotes and Sources:
Text:
- CBOE:VIX Volatility Index
- JP Morgan Asset Management, Standard and Poor's as of 3/31/2026.
- IMF World Economic Outlook Update: April 2026.
- University of Michigan: Consumer Confidence 1971 - March 2026.
- Morningstar: MSCI AC World ex-US NR USD. 12/31/2025 - 3/31/2026.
- Morningstar: S&P 500 TR. 12/31/2025 - 3/31/2026.
- Morningstar: MSCI Emerging Markets NR USD. 12/31/2025 - 3/31/2026.
- Morningstar: S&P 500 Magnificent 7. 12/31/2025 - 3/31/2026.
- Morningstar: S&P 500 Value. 12/31/2025 - 3/31/2026.
- Morningstar: Bloomberg US Aggregate Bond Index. 12/31/2025 - 3/31/2026.
- Morningstar:Bloomberg Global Ex. US Aggregate Bond Index. 12/31/2025 - 3/31/2026.
Charts:
Impact of Oil Prices on the Economy
Source: JP Morgan Asset Management; (Left) Department of Energy; (Top right) BEA; (Bottom right) BLS.
(Bottom right) Data sourced from the 2024 Consumer Expenditure Survey. *Petroleum and related product export data from the BEA are unavailable prior to 1985. Data shown before 1985 present petroleum and related product imports as a share of nominal GDP. Data as of 3/31/2026.
Higher Gas Prices cross the Country
Source: AAA. Karl Russell of New York Times. As of 5/6/2026.
Expected Market Returns and Risks, 7-10 Year Horizon: As of 3/31/2026.
Source: Stembrook Research.
(1) Volatility is measured in terms of Standard Deviation. Standard deviation is the statistical measurement of dispersion about an average, which depicts how widely a stock or portfolio’s returns varied over a certain period of time. Investors use the standard deviation of historical performance to try to predict the range of returns that is most likely for a given investment. When an investment has a high standard deviation, the predicted range of performance is wide, implying greater volatility. If an investment’s returns follow a normal distribution, then approximately 68 percent of the time they will fall within one standard deviation of the mean return of the investment, and 95 percent of the time within two standard deviations. For example, for a portfolio with a mean annual return of 10 percent and a standard deviation of two percent, you would expect the return to be between 8 and 12 percent about 68 percent of the time, and between 6 and 14 percent about 95 percent of the time. Source: Morningstar.
Historical Market Returns: As of 3/31/2026.
Source: Morningstar, Stembrook Research.
Indices: Bloomberg Barclays U.S Treasury Bills 1-3 Month Total Return, Bloomberg Barclays Municipal Bond 5 Year (4-6) Total Return, Bloomberg Barclays US Aggregate Bond Total Return, Bloomberg Barclays US Corporate High Yield Total Return, FTSE All Equity REIT Total Return, S&P 500 Composite Total Return, S&P SmallCap 600 Total Return, MSCI EAFE Total Return, MSCI EM (Emerging Markets) Total Return, Consumer Price Index – US, S&P 10 Year US TIPS Total Return, Bloomberg Commodity (Total Return) Index.
Yields Across Asset Classes: As of 3/31/206.
Sources: Cash Equivalents Yields since March 1976. Ibbotson, Federal Reserve Bank, Thomson Reuters, Municipal Bond Yields since March 1988. Barclays Capital, Charles Schwab, BofA Merrill Lynch, Standard & Poor's/Investortools Municipal Bond Indices, Investment Grade Bond Yields since March 1976. Barclays Capital, High Yield since December 1984. BofA Merrill Lynch, Barclays Capital, Real Estate (Public) Earnings Yield since March 1976. NAREIT all Equity, Large Cap US Equity Earnings Yield since March 1976. Standard & Poor's, BARRA, Mid Cap US Equity Earnings Yield since June 1991. Standard & Poor's, BARRA, Small Cap US Equity Earnings Yield since December 1993. Standard & Poor’s, BARRA, Developed Europe Equity Earnings Yield since March 1976. MSCI Europe, Standard & Poor's Europe 350, Developed Pacific Equity Earnings Yield since March 1976. MSCI Pacific, S&P/Citi PMI Asia Pacific, S&P Asia 50, Emerging Market Equity Earnings Yield since December 1998, Inflation-Linked Bond Real Yield to Maturity since March 1997. Citi Yield Book, Federal Reserve Bank. Note: Yields are not perfect predictors of future returns and should not be used in isolation.
Global Asset Class Returns: As of 12/31/2025.
Source: Thomson Reuters, Bloomberg, Morningstar, Stembrook Research.
Indices: Consumer Price Index – US, US 30-Day Treasury Bills, Bloomberg Barclays US Treasury Bills: 1-3 Month Index, Citigroup Inflation-Linked Index, S&P 10 Year US TIPS Index, Bloomberg Barclays US Aggregate Bond Index, BofA Merrill Lynch US High Yield Cash Pay, Bloomberg Barclays US Corporate High Yield Index, Dow Jones Wilshire REIT Index, FTSE All Equity REIT Index, S&P 500 Composite Total Return, S&P SmallCap 600 Total Return, MSCI EAFE Index, MSCI EM (Emerging Markets) Index, Dow Jones AIG Commodity (Totl Ret) Index, Bloomberg Commodity Index.
Disclosures
This material is intended to inform you of products and services offered by Stembrook Asset Management, LLC (“Stembrook”). Stembrook is a US Securities and Exchange Commission Registered Investment Advisor.
This material is not intended as an offer or solicitation for the purchase or sale of any financial instrument.
We believe the information contained in this material to be reliable but do not warrant its accuracy or completeness. The opinions, estimates, and investment strategies and views expressed in this document constitute the judgment of Stembrook, based on current market conditions and are subject to change without notice. The investment strategies stated here may differ from those expressed for other purposes or in other context.
Past performance is not indicative of future results.
The obligations and securities sold, offered, or recommended are not deposits and are not insured by the FDIC, the Federal Reserve Bank, or any governmental agency.
The views and strategies described herein may not be suitable for all investors. This material is presented with the understanding that it is not rendering accounting, legal or tax advice. Please consult your legal or tax adviser concerning such matters.
Important note regarding Stembrook’s capital market expectations.
The capital market expectations developed by Stembrook Asset Management are estimates of both a central tendency of asset class behavior and a probable range of asset class behavior over a long-term horizon. These estimates are one of many inputs used in the portfolio construction process, and should not be used independently. These expectations should not be construed as the returns that will be achieved, but merely those that may be achieved if certain assumptions hold true. Also note that each client's portfolio may differ given specific goals and constraints applied to the portfolio construction process.
Additional information is available upon request.